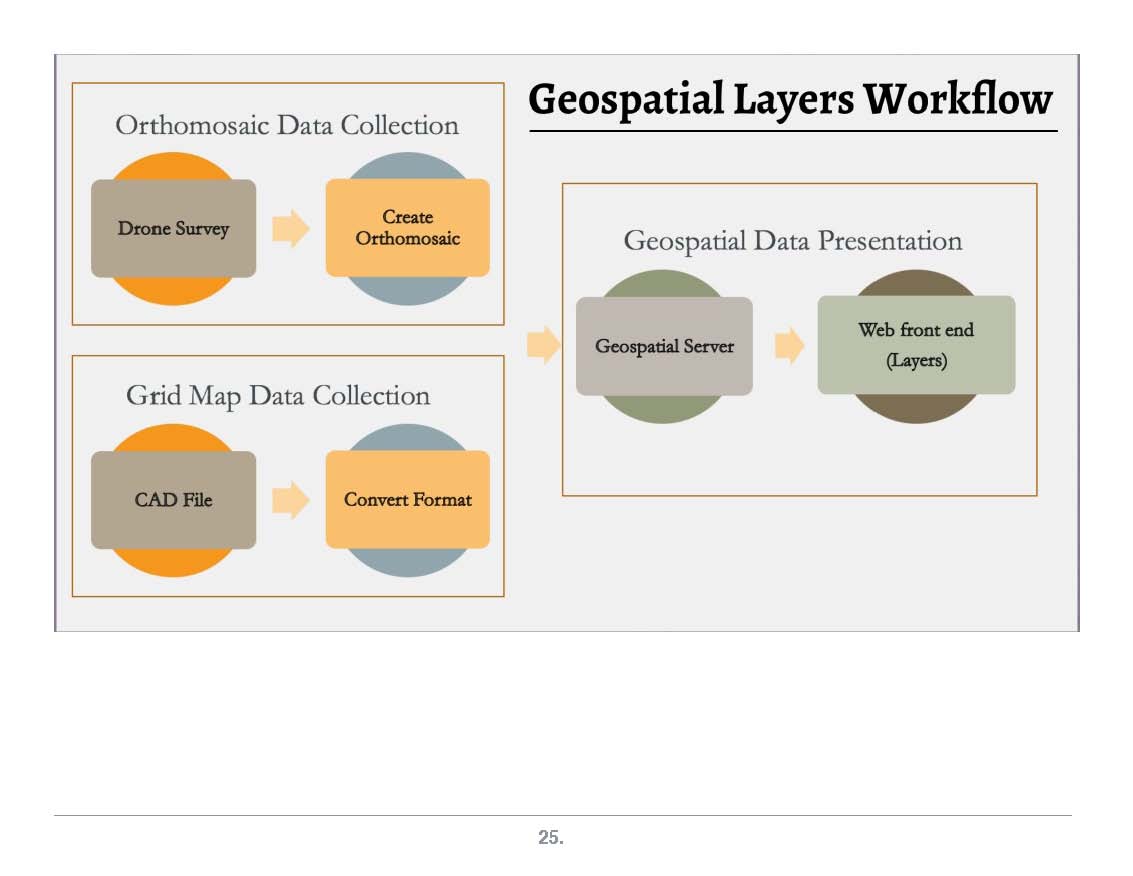
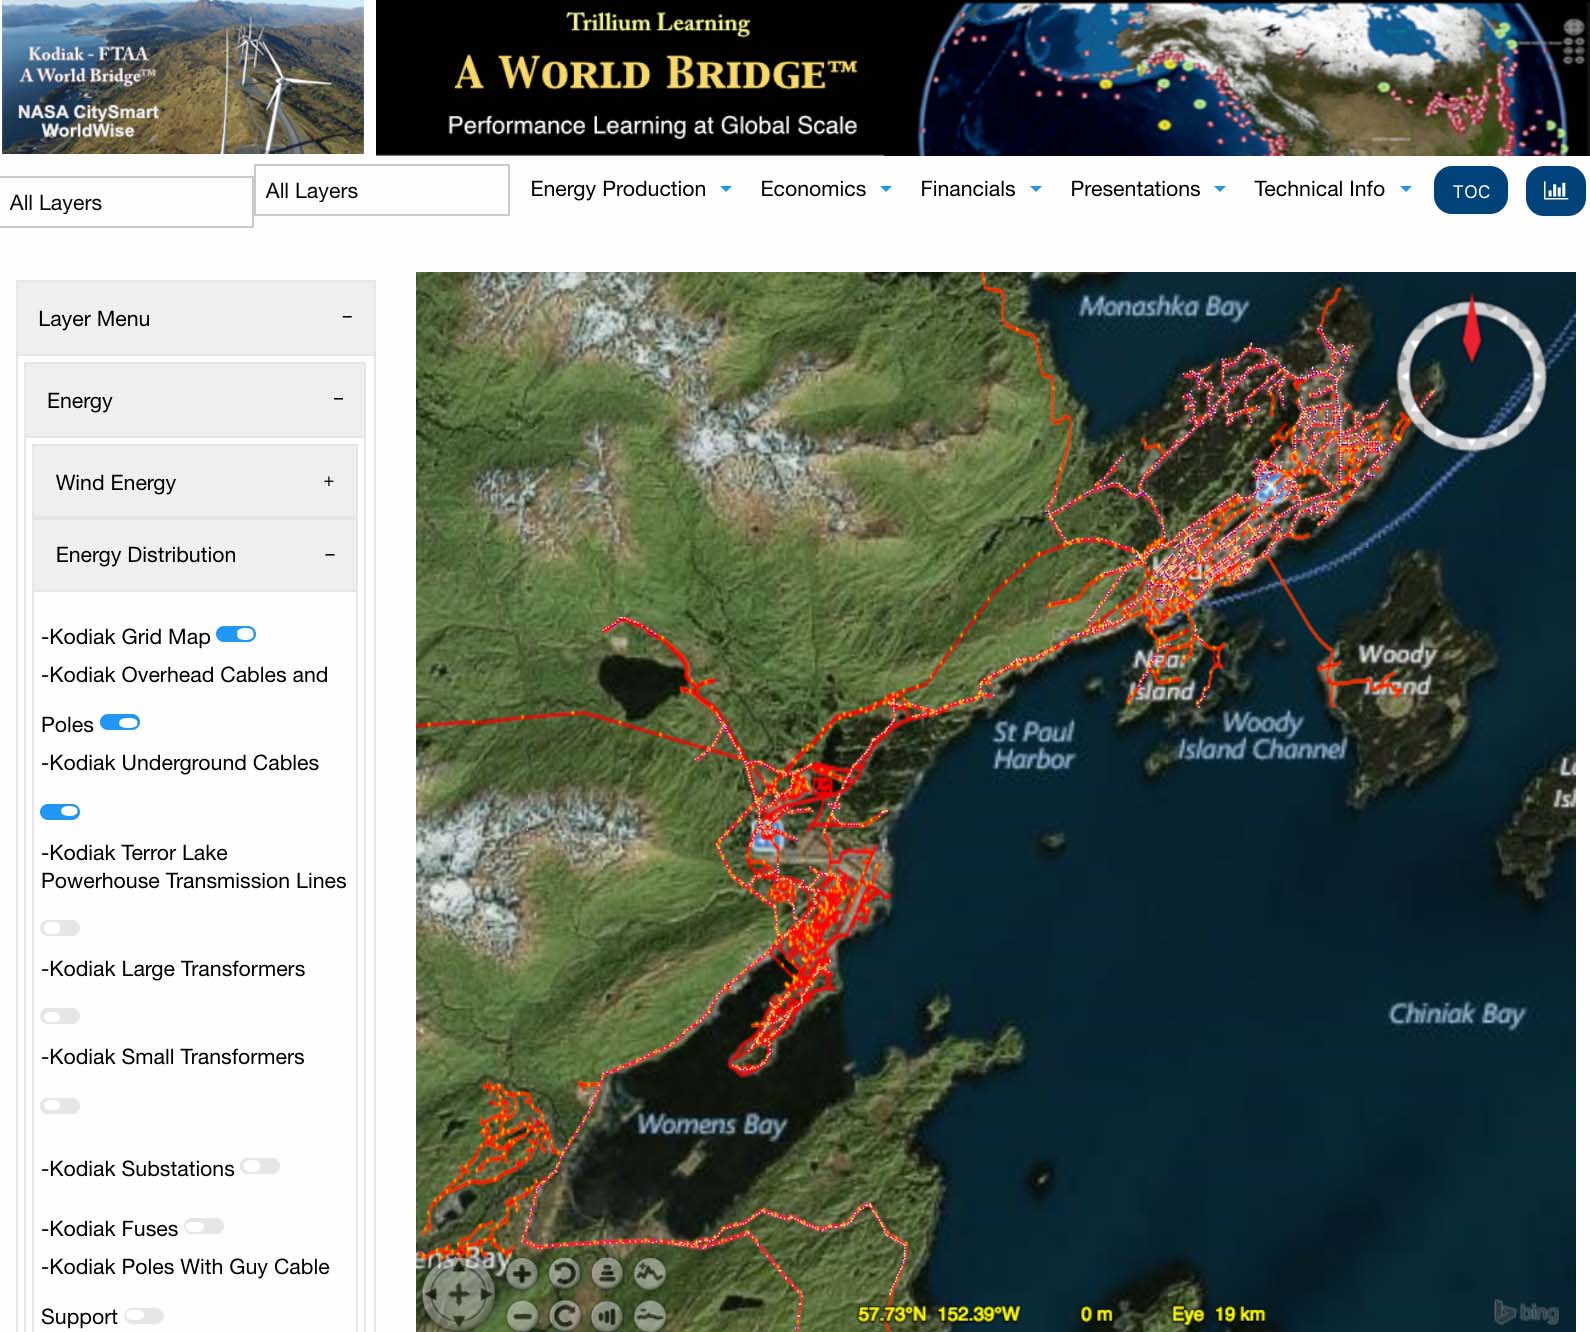
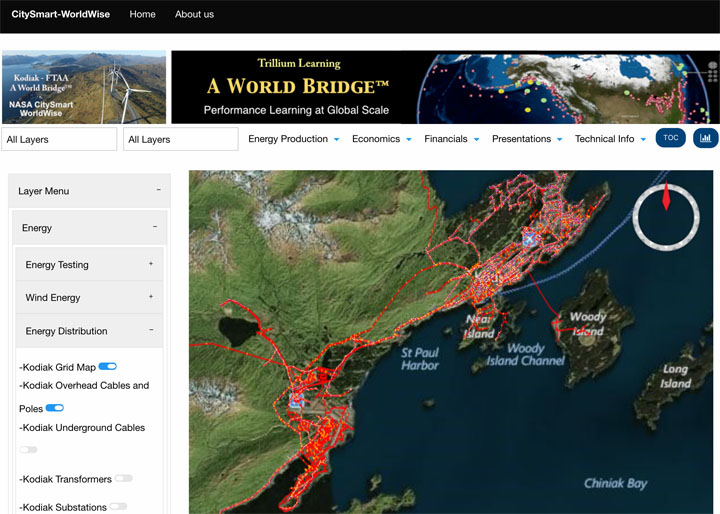
This workflow diagram shows how the orthomosaics and grid layers are projected onto the globe. For the orthomosaics, hundreds of high resolution photos are taken from above the site using high-definition cameras on drones from our Unmanned Aircraft Systems-Scientific Applications team; these are then converted into orthomosaic Geo-rectified maps of the location using various software programs. For the various grids available in this application, our partner, Kodiak Electric Association, provided us with a CAD file that we extracted DWGs from and then converted into GIS shape files. Once the orthomosaics are completed and the grid layers are in the correct format, they are stored in a geospatial server accessed through JavaScript to add the layers to the globe.
This next workflow diagram is a more in depth version of the previous diagram. It also features the construction of the Placemarks on the globe. The Placemarks are defined in a single .csv file that is processed through JavaScript and added to the globe; their pop-up boxes are created dynamically from the information in the .csv files. Once a placemark is located, it checks for the location inside the parsed .csv and identifies location of the required information. After locating the information, it is input into another JavaScript function that changes the html of the pop-up box and triggers visualization.
.jpg)
